
Setting up GCP logging and alerting with custom structured logs
Background
Today we’ll look at a key aspect of cloud computing: logging and monitoring.
Writing code is the beginning of a journey that many consider to end with the deployment of that code. More seasoned programmers (or perhaps SREs) will tell you the journey is not nearly done by the time code is shipped. Once your program is out there and actually being executed, understanding how that code behaves and evolves is as important as the code itself.
Things like availability, latency, performance, and emergency response are things to think about once your code is out there and being used by others. Imagine, for example, a website going live, but seeing load times deteriorate over time; or perhaps an API endpoint that suddenly starts returning erroneous responses. Is this the code’s fault? Is the API being used incorrectly? Is this a new thing, or has it always been that way? Setting up proper logging and monitoring can help with understanding why this things are happening.
Logging and Monitoring
There’s several resources out there showing how to set up logging and monitoring with Google Cloud’s operations suite, but the focus today is on how to set up alerting that includes information from log entries. For example, a string that specifies what the error was, or where it occurred. This is known as log-based metrics. There’s two different kinds of log-based metrics:
-
System-defined log-based metrics, provided by Cloud Logging for use by all Google Cloud projects. Thing of these as metrics that come out of the box.
-
User-defined log-based metrics, our main focus, which are created by users to extract values from logs by using custom defined filters.
We’ll create a user-defined, log-based metric since it provides the needed flexibility to accommodate for the custom alert message. Using a counter metric, we can define a few labels and fields to extract from the logs when using something like structured logs.
Structured Logs
Structured logs make use of the jsonPayload field to add, well, structure to the log payload. Logs can
be written in different ways (Cloud Logging API, gcloud, serializing JSON, etc). For sake of simplicity, we’ll be using gcloud commands to create logs.
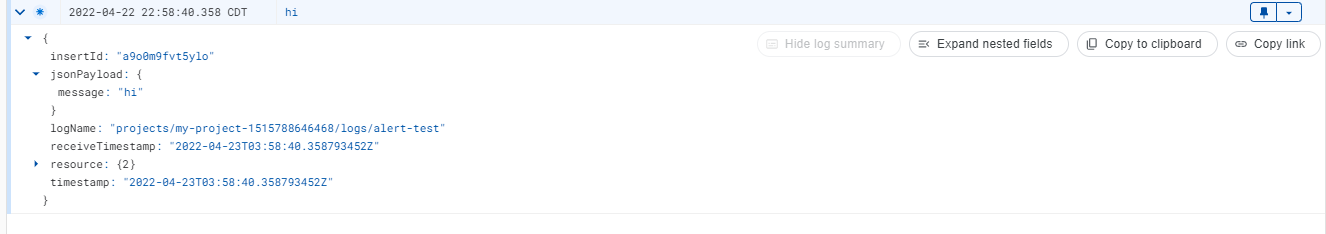
Using the gcloud logging write (docs) command, we can create logs that will make use of the jsonPayload field. To try this, use the command below.
gcloud logging write alert-test '{"message": "hi"}' --payload-type=json
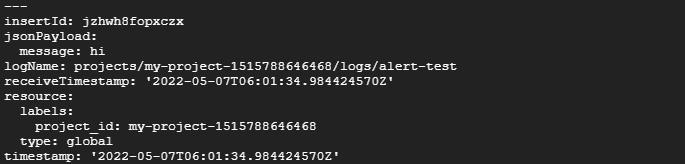
You should see the logs in Google Cloud’s Logs Explorer page. Alternatively, you can also read log entries using gcloud logging read <log-name>.
Step 1: Create a user-defined logs-based metric
Begin by creating a counter metric. The GCP UI will ask you to supply things like the metric name, a description for it, and the units.
When creating your metric, make sure to use the Filter Section to verify the logs you intend to use are being properly filtered. This portion let’s you use the logging query language or a regular expressiosn to filter log content. This is needed because the logs that match the filter will be the ones to pull data from. Move on to the labels section.
Step 2: Specify the labels to extract from the logs
Since we’ll be using structured logs, we can access parts of the jsonPayload field to create specific labels. In the example below, the label nodeOrigin was defined. It is a string pulled from the jsonPayload.node field. The regex field was left empty, since we want to extract the
whole jsonPayload.node field, not a portion of it. To test your regex, hit the PREVIEW button to pull logs and verify the information is matched. You can see the content that is extraced by the greem highlight.
Step 3: Create the alert and set up triggers, notifications and documentation
Now that you’re created the log-based metric, you can click on the three-dot menu to do things like view logs for the metric, edit, or create alerts.
From here, click on “Create alert from metric.” Once on the alert creations screen, create the alerting policy.
The alert policy is defined by three things:
- The condition you want to track (trigger)
- The way in which communications will be handled (notifications)
- Additional content and messaging to include (documentation)
Step 3.1: Set up the trigger
Add a condition for your alert to trigger. Since the goal here is to notify as soon as the error occurs, it can be defined as follows:
Metric: The previously created metric.
Filter: None Group By: None Aggregator: None Period: 5 minutes (customizable to your need) Condition: Any time series violates Condition: is above Threshold: 0 For: most recent value
This means the alert will trigger every time the error logs go above 0.
Note: Note: The trigger condition should have a none aggregator. If the trigger condition uses any other aggregator, the alert will try to aggregate strings which will result in a null value being returned. Read more about this here.
Step 3.2: Set up the notifications
You can make use of several notification channels. Some of these include SMS, email, webhooks, etc. For sake of simplicity, we’ll go with a previously created email channel.
You’ll need to specify the notification channel (or multiple) as well as things like when should alerts autoclose, or if notifications should be provided on incident closures.
Step 3.3: Set up the documentation portion
Next you can define the alert name, and the information to include in the alert message. The documentation portion of the alert allows you to include several variables, including the user-defined labels previously created. All variables are listed here.
Step 4: Test the alert and notifications
Test the alert to make sure it is triggering properly and contains the expected message. This can be done by generation more structured logs using gcloud:
gcloud logging write alert-test '{"message": "You might need to delete zombie
dask tasks on: central_node", "node": "central_node"}' --payload-type=json
The alert should be triggered and an alert be sent via the notifications channels set up.